1. Introduction & Why Calendar Months Fall Short
In the financial media, seasonality is almost always expressed in traditional calendar months: "September is the worst month of the year" or "Sell in May and go away".
For professional quant desks and option traders, however, these calendar statistics fall seriously short. Large institutional portfolios do not rebalance on arbitrary calendar days; they navigate by monthly option expiration (OpEx): the 3rd Friday of every month. Around this date, hundreds of billions of dollars in index options, derivatives and futures expire, leading to a massive unwind of dealer gamma and a repositioning of institutional liquidity.
The 24-Period Split (OpEx 1H vs 2H)
In this study we analyse 33 years of daily S&P 500 price data (SPY 1993 – 2026). We divide each market year into 12 consecutive OpEx cycles (3rd Friday to 3rd Friday) and split each cycle exactly into two halves of roughly 10 trading days:
• 1st Half (1H: Post-OpEx & Month Start): the first ~10 trading days after expiration Friday (including the start of the new calendar month).
• 2nd Half (2H: Pre-OpEx & Expiration Run): the final ~10 trading days in the run-up to the next 3rd Friday.
2. The 24-Period Seasonal Calendar (Infographic)
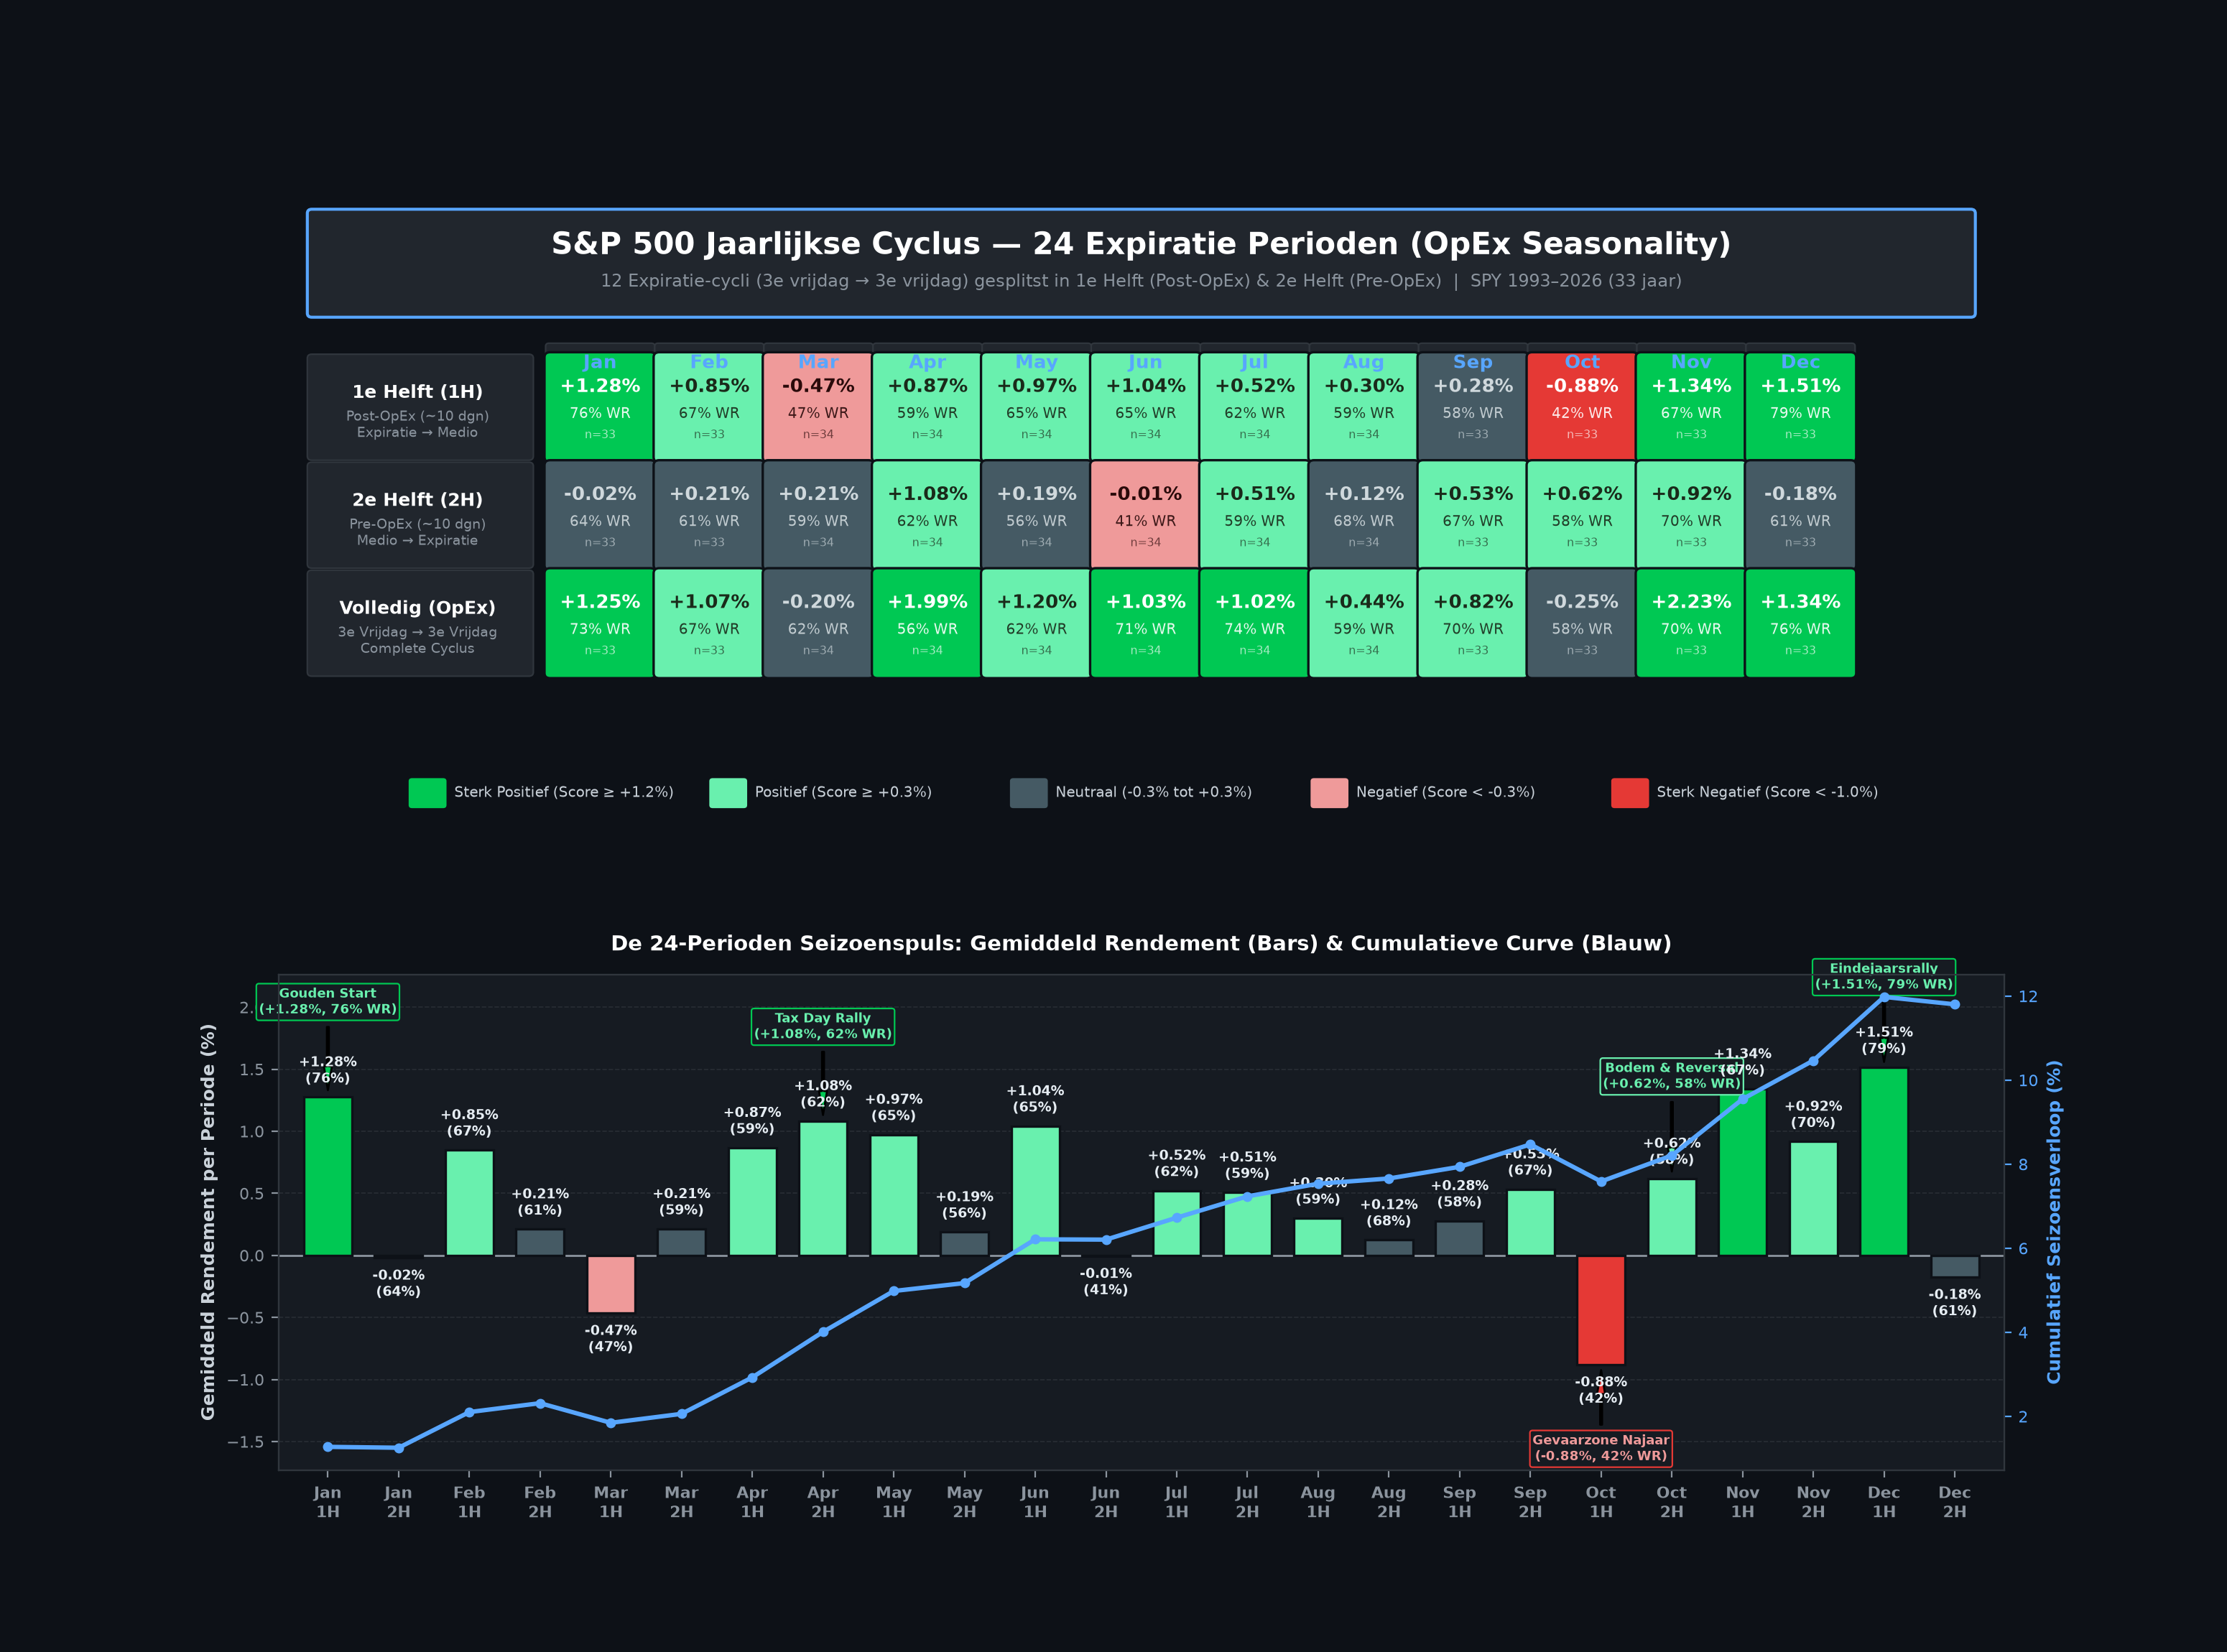
The data visualisation below combines two perspectives: at the top, the 12 expiration months with their 1st-half, 2nd-half and total cycle return (classified by average return and win rate). At the bottom, the chronological 24-period seasonal pulse from January to December with the cumulative price curve.
3. Full Data Table: All 24 Seasonal Periods
Below are the core empirical statistics for each of the 24 seasonal periods over 33 completed market years (8,458 trading days):
| Expiration Month | Period | Phase & Character | Avg. Return | Median | Win Rate (%) | Classification |
|---|---|---|---|---|---|---|
| January | 1H | Post-Dec OpEx & New-Year Inflows | +1.28% | +1.31% | 76% | Strongly Positive |
| January | 2H | Pre-Jan OpEx consolidation | -0.02% | +0.48% | 64% | Neutral |
| February | 1H | Post-Jan OpEx & Early Feb Rally | +0.85% | +1.10% | 67% | Positive |
| February | 2H | Pre-Feb OpEx | +0.21% | +0.45% | 61% | Neutral |
| March | 1H | Post-Feb OpEx (Spring Dip) | -0.47% | -0.12% | 47% | Negative (Q1 Dip) |
| March | 2H | Pre-Q1 Triple Witching Recovery | +0.21% | +0.33% | 59% | Neutral |
| April | 1H | Post-March OpEx & Early April | +0.87% | +0.88% | 59% | Positive |
| April | 2H | Tax-Day Run-up to April OpEx | +1.08% | +1.03% | 62% | Strongly Positive |
| May | 1H | Post-Apr OpEx & May Start | +0.97% | +1.12% | 65% | Positive |
| May | 2H | Pre-May OpEx | +0.19% | +0.24% | 56% | Neutral |
| June | 1H | Post-May OpEx & Early June | +1.04% | +0.89% | 65% | Positive |
| June | 2H | Pre-Q2 Triple Witching Dip | -0.01% | -0.32% | 41% | Weak (Lowest WR of Summer) |
| July | 1H | Post-June OpEx & Mid-Year Inflows | +0.52% | +0.76% | 62% | Positive |
| July | 2H | Pre-July OpEx Earnings Rally | +0.51% | +0.95% | 59% | Positive |
| August | 1H | Post-July OpEx | +0.30% | +0.55% | 59% | Neutral |
| August | 2H | Pre-Aug OpEx (Summer Lull) | +0.12% | +0.39% | 68% | Neutral |
| September | 1H | Post-Aug OpEx & Labor Day | +0.28% | +0.47% | 58% | Neutral |
| September | 2H | Pre-Q3 Triple Witching Run-up | +0.53% | +0.78% | 67% | Positive |
| October | 1H | Post-Sep OpEx → Late Sep / Early Oct | -0.88% | -0.78% | 42% | Strongly Negative (Danger Zone) |
| October | 2H | Pre-Oct OpEx (Seasonal Bottom & Reversal) | +0.62% | +0.71% | 58% | Positive (The Great Reversal) |
| November | 1H | Post-Oct OpEx & Start of November | +1.34% | +1.40% | 67% | Strongly Positive |
| November | 2H | Pre-Nov OpEx (Thanksgiving Run-up) | +0.92% | +0.95% | 70% | Strongly Positive |
| December | 1H | Post-Nov OpEx (Thanksgiving → Early December) | +1.51% | +1.63% | 79% | Strongly Positive (Best Period) |
| December | 2H | Pre-Q4 Quadruple Witching | -0.18% | +0.22% | 61% | Neutral (Profit Taking) |
4. Five Key Market Insights
Insight 5: The Difference in Character between 1H and 2H
Across the whole year, the 1st Half (1H: Post-OpEx & Month Start) delivers an average return of +0.65%. This is the phase in which new institutional capital (pension funds, payroll inflows, 401(k)s) is pumped into the market. The 2nd Half (2H: Pre-OpEx & Expiration Run) returns +0.36% on average, but acts as the critical catalyst for major market turns (such as the bottom in October 2H and the tax rally in April 2H).
5. Practical Trading Rules for Investors & Option Traders
How do you translate these 24 seasonal periods into systematic execution and risk management?
Maximum Bullish Size in Golden Windows
Lean aggressively into long equity, covered calls and bull put credit spreads during the statistical top periods: December 1H (79% WR), January 1H (76% WR), November 1H/2H (67–70% WR) and April 2H (62% WR). These periods have the best risk/reward of the year.
Hedge Before September OpEx (Danger Zone October 1H)
Don't be fooled by a calm first half of September. Take profits on vulnerable long positions or buy tail-risk hedges (long puts / VIX calls) in the week of September expiration (mid-September). October 1H (late September through early October) historically shows the heaviest declines (-0.88%, 42% WR).
The "October OpEx Dip-Buy" Rule
Once the autumn dip in October 1H has run its course, prepare to allocate aggressively to equities or short put positions in October 2H (between 10 and 18 October). This point marks the historical launch pad for the Q4 year-end rally.
Stay Alert During June 2H & March 1H Consolidations
Close credit spreads early or reduce position size in March 1H (-0.47%, 47% WR) and June 2H (-0.01%, 41% WR). These are the two periods in the first half of the year with the highest downside drift and whipsaw risk.