1. Introduction & Macro Theoretical Foundation
Financial markets do not operate in a vacuum. Political incentives, fiscal stimulus schedules, and election timelines exert a massive structural force on equity performance. The 4-Year Presidential Election Cycle Theory (first popularized by Yale Hirsch) is one of the most reliable and statistically validated macro-patterns in modern market history.
The fundamental rationale is straightforward: newly elected administrations tend to front-load unpopular economic policies during the first two years of their term when political capital is highest. Conversely, in the final two years leading up to the election, policy pivots toward economic stimulus to foster voter optimism and equity market strength.
The OpEx-to-OpEx Edge
In this research, we take the standard macroeconomic analysis one step further. Rather than using traditional calendar months (1st to 1st), we evaluated whether measuring performance from Options Expiration to Options Expiration (OpEx: 3rd Friday to 3rd Friday) yields cleaner, more reliable trading signals for quantitative traders and systematic option desks.
2. The Four Stages of the Cycle
The 4-year cycle is divided into four distinct market phases, each exhibiting unique risk-reward profiles, volatility clustering, and seasonal tailwinds:
Examples: 2021, 2025, 2029
Examples: 2022, 2026, 2030
Examples: 2023, 2027, 2031
Examples: 2020, 2024, 2028
Detailed Breakdown per Cycle Phase
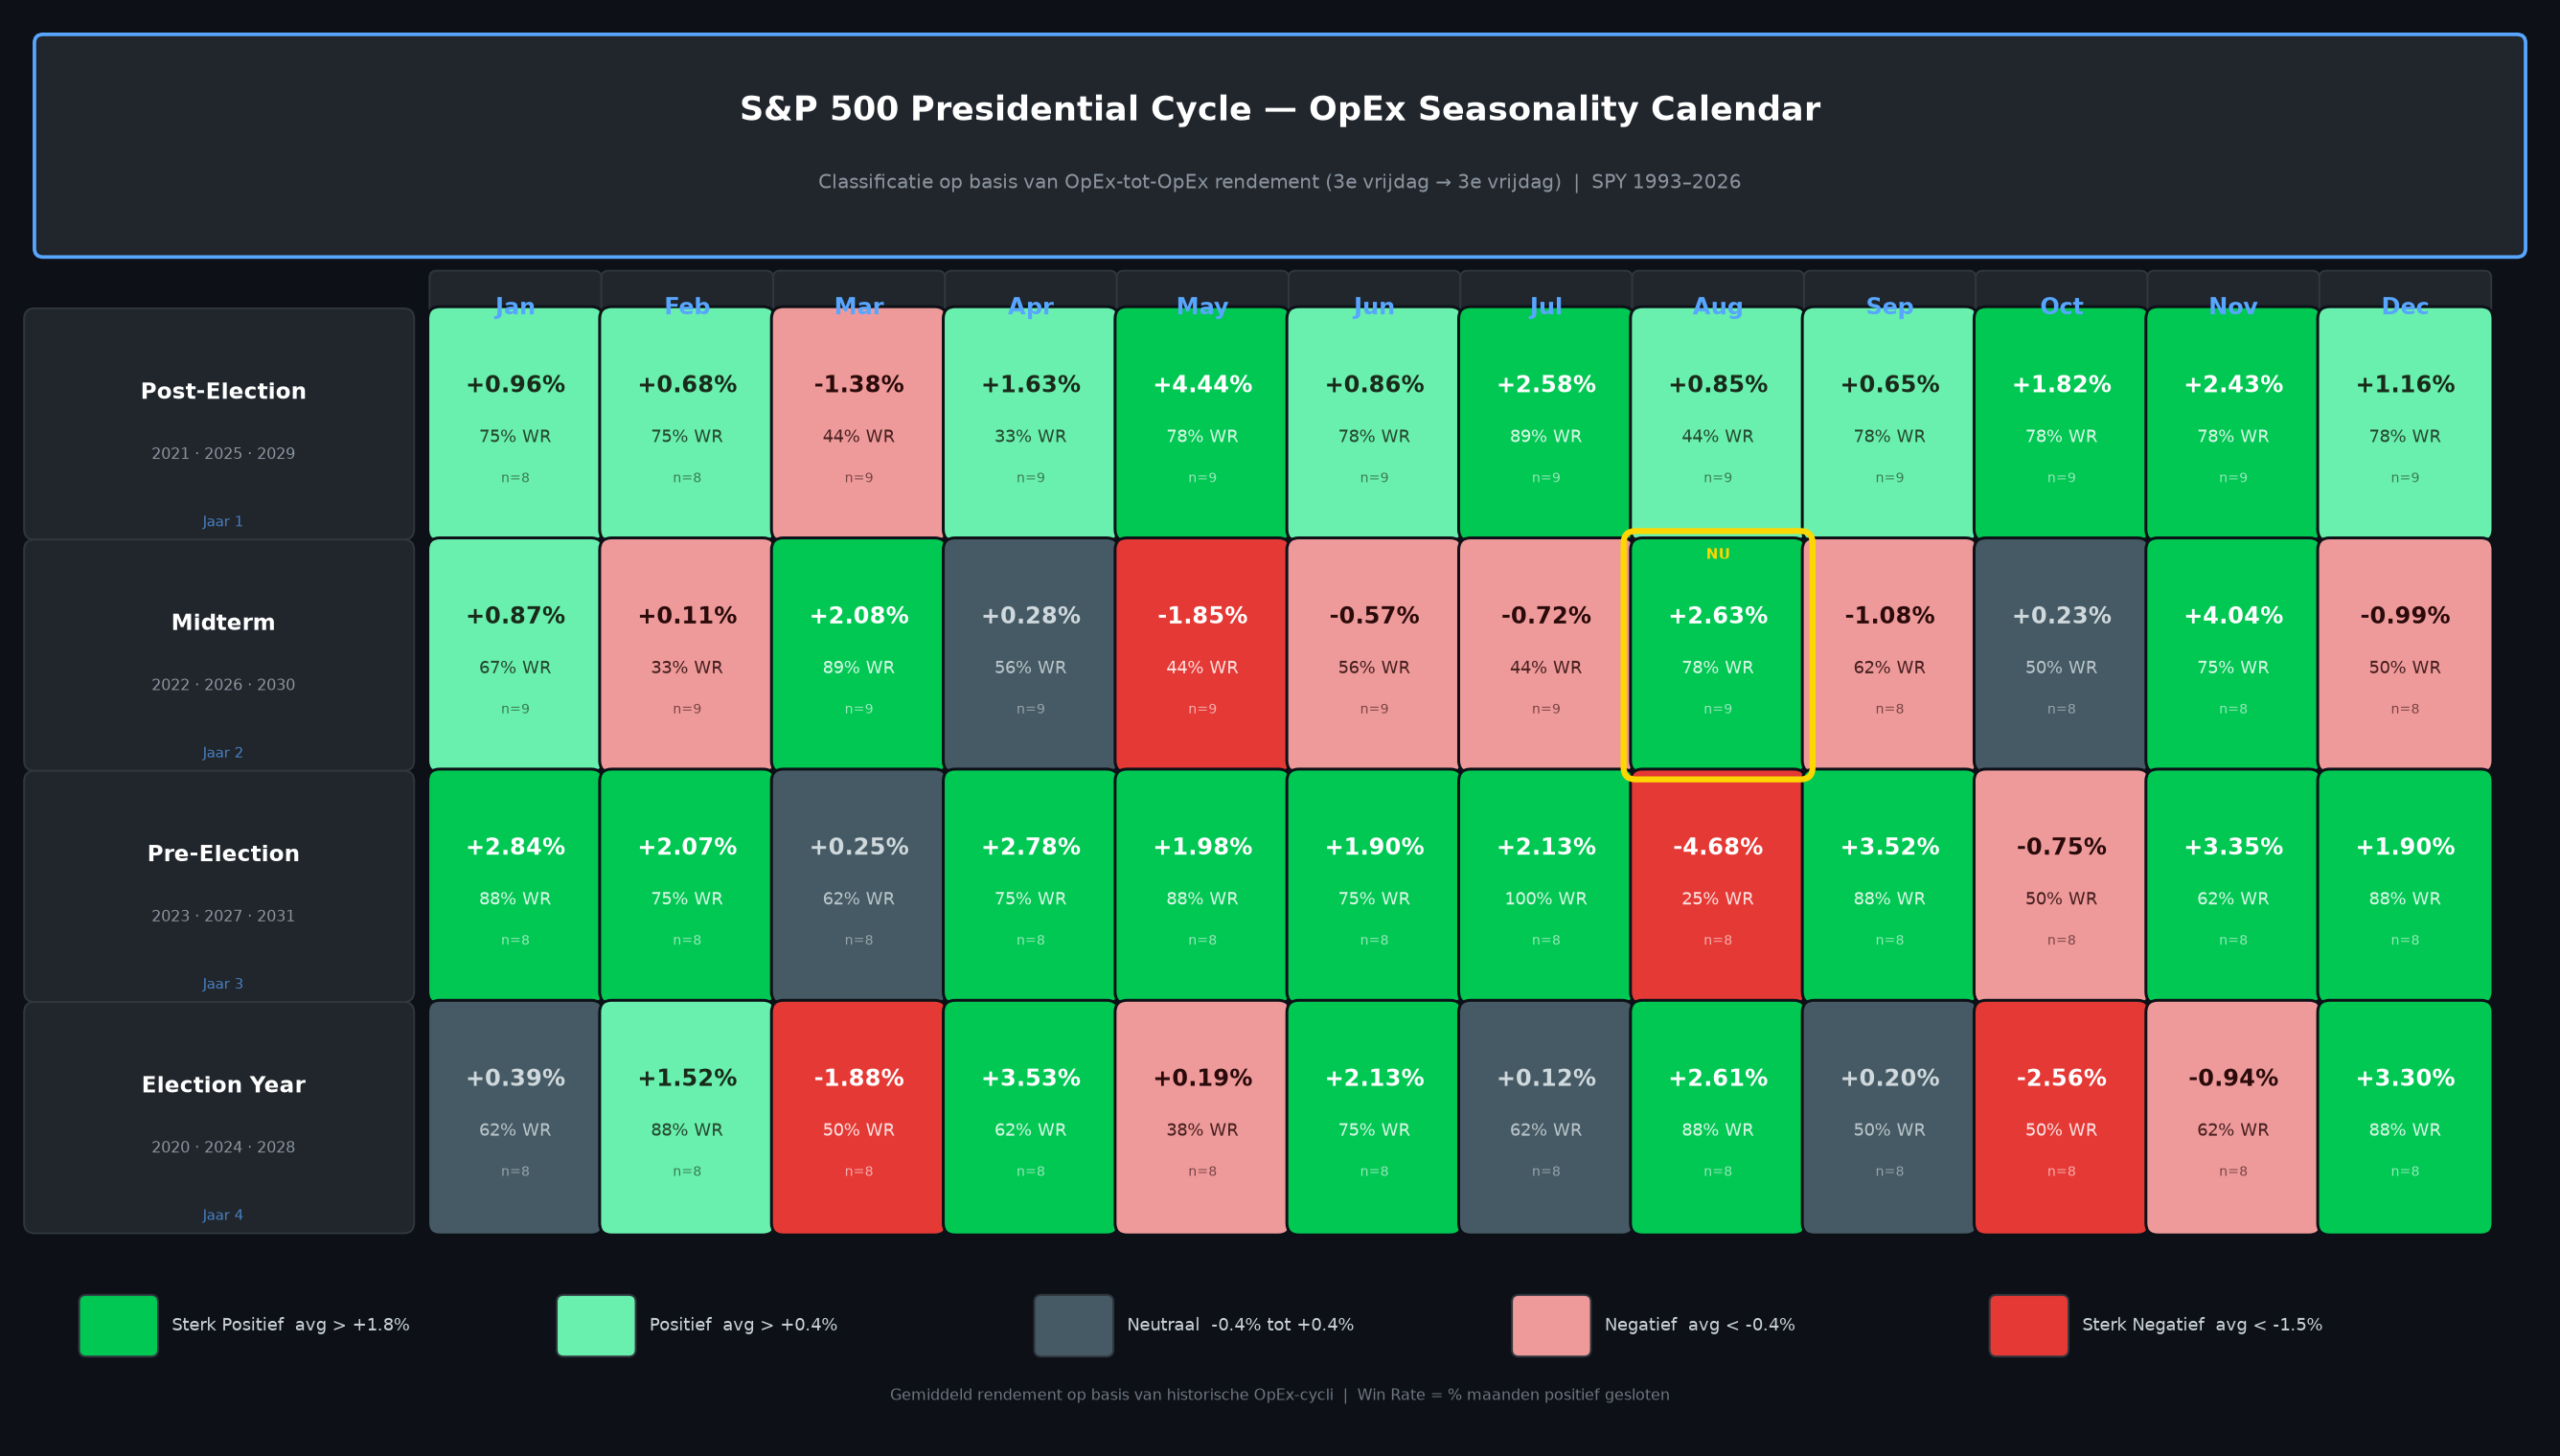
Year 1 — Post-Election (e.g., 2025): Newly elected administrations implement their main reform agendas early. Equity markets demonstrate strong momentum in May (+4.44% average return, 78% Win Rate) and July (+2.58%, 89% WR), with March (-1.38%) representing the only persistent weak spot.
Year 2 — Midterm (e.g., 2026): The classic "Summer Valley" takes hold across May (-1.85%), June (-0.57%), and July (-0.72%). September (-1.08%) carries high volatility from 3rd Friday August to 3rd Friday September. However, as vote counting concludes, the Midterm Relief Rally in November (+4.04%, 75% WR) delivers explosive gains.
Year 3 — Pre-Election (e.g., 2027): Statistically the engine room of equity bull markets. July boasts an incredible 100% historical Win Rate across the entire 33-year SPY dataset. The critical danger point is August (-4.68%, 25% WR), which registers the deepest single drawdown in the matrix before rebounding sharply in September (+3.52%).
Year 4 — Election Year (e.g., 2024, 2028): February (+1.52%), April (+3.53%), and June (+2.13%) exhibit solid resilience. October (-2.56%) experiences aggressive hedging ahead of voting day, immediately resolved by the December (+3.30%, 88% WR) post-election continuation rally.
3. Calendar Month vs. OpEx-to-OpEx: Signal Quality Comparison
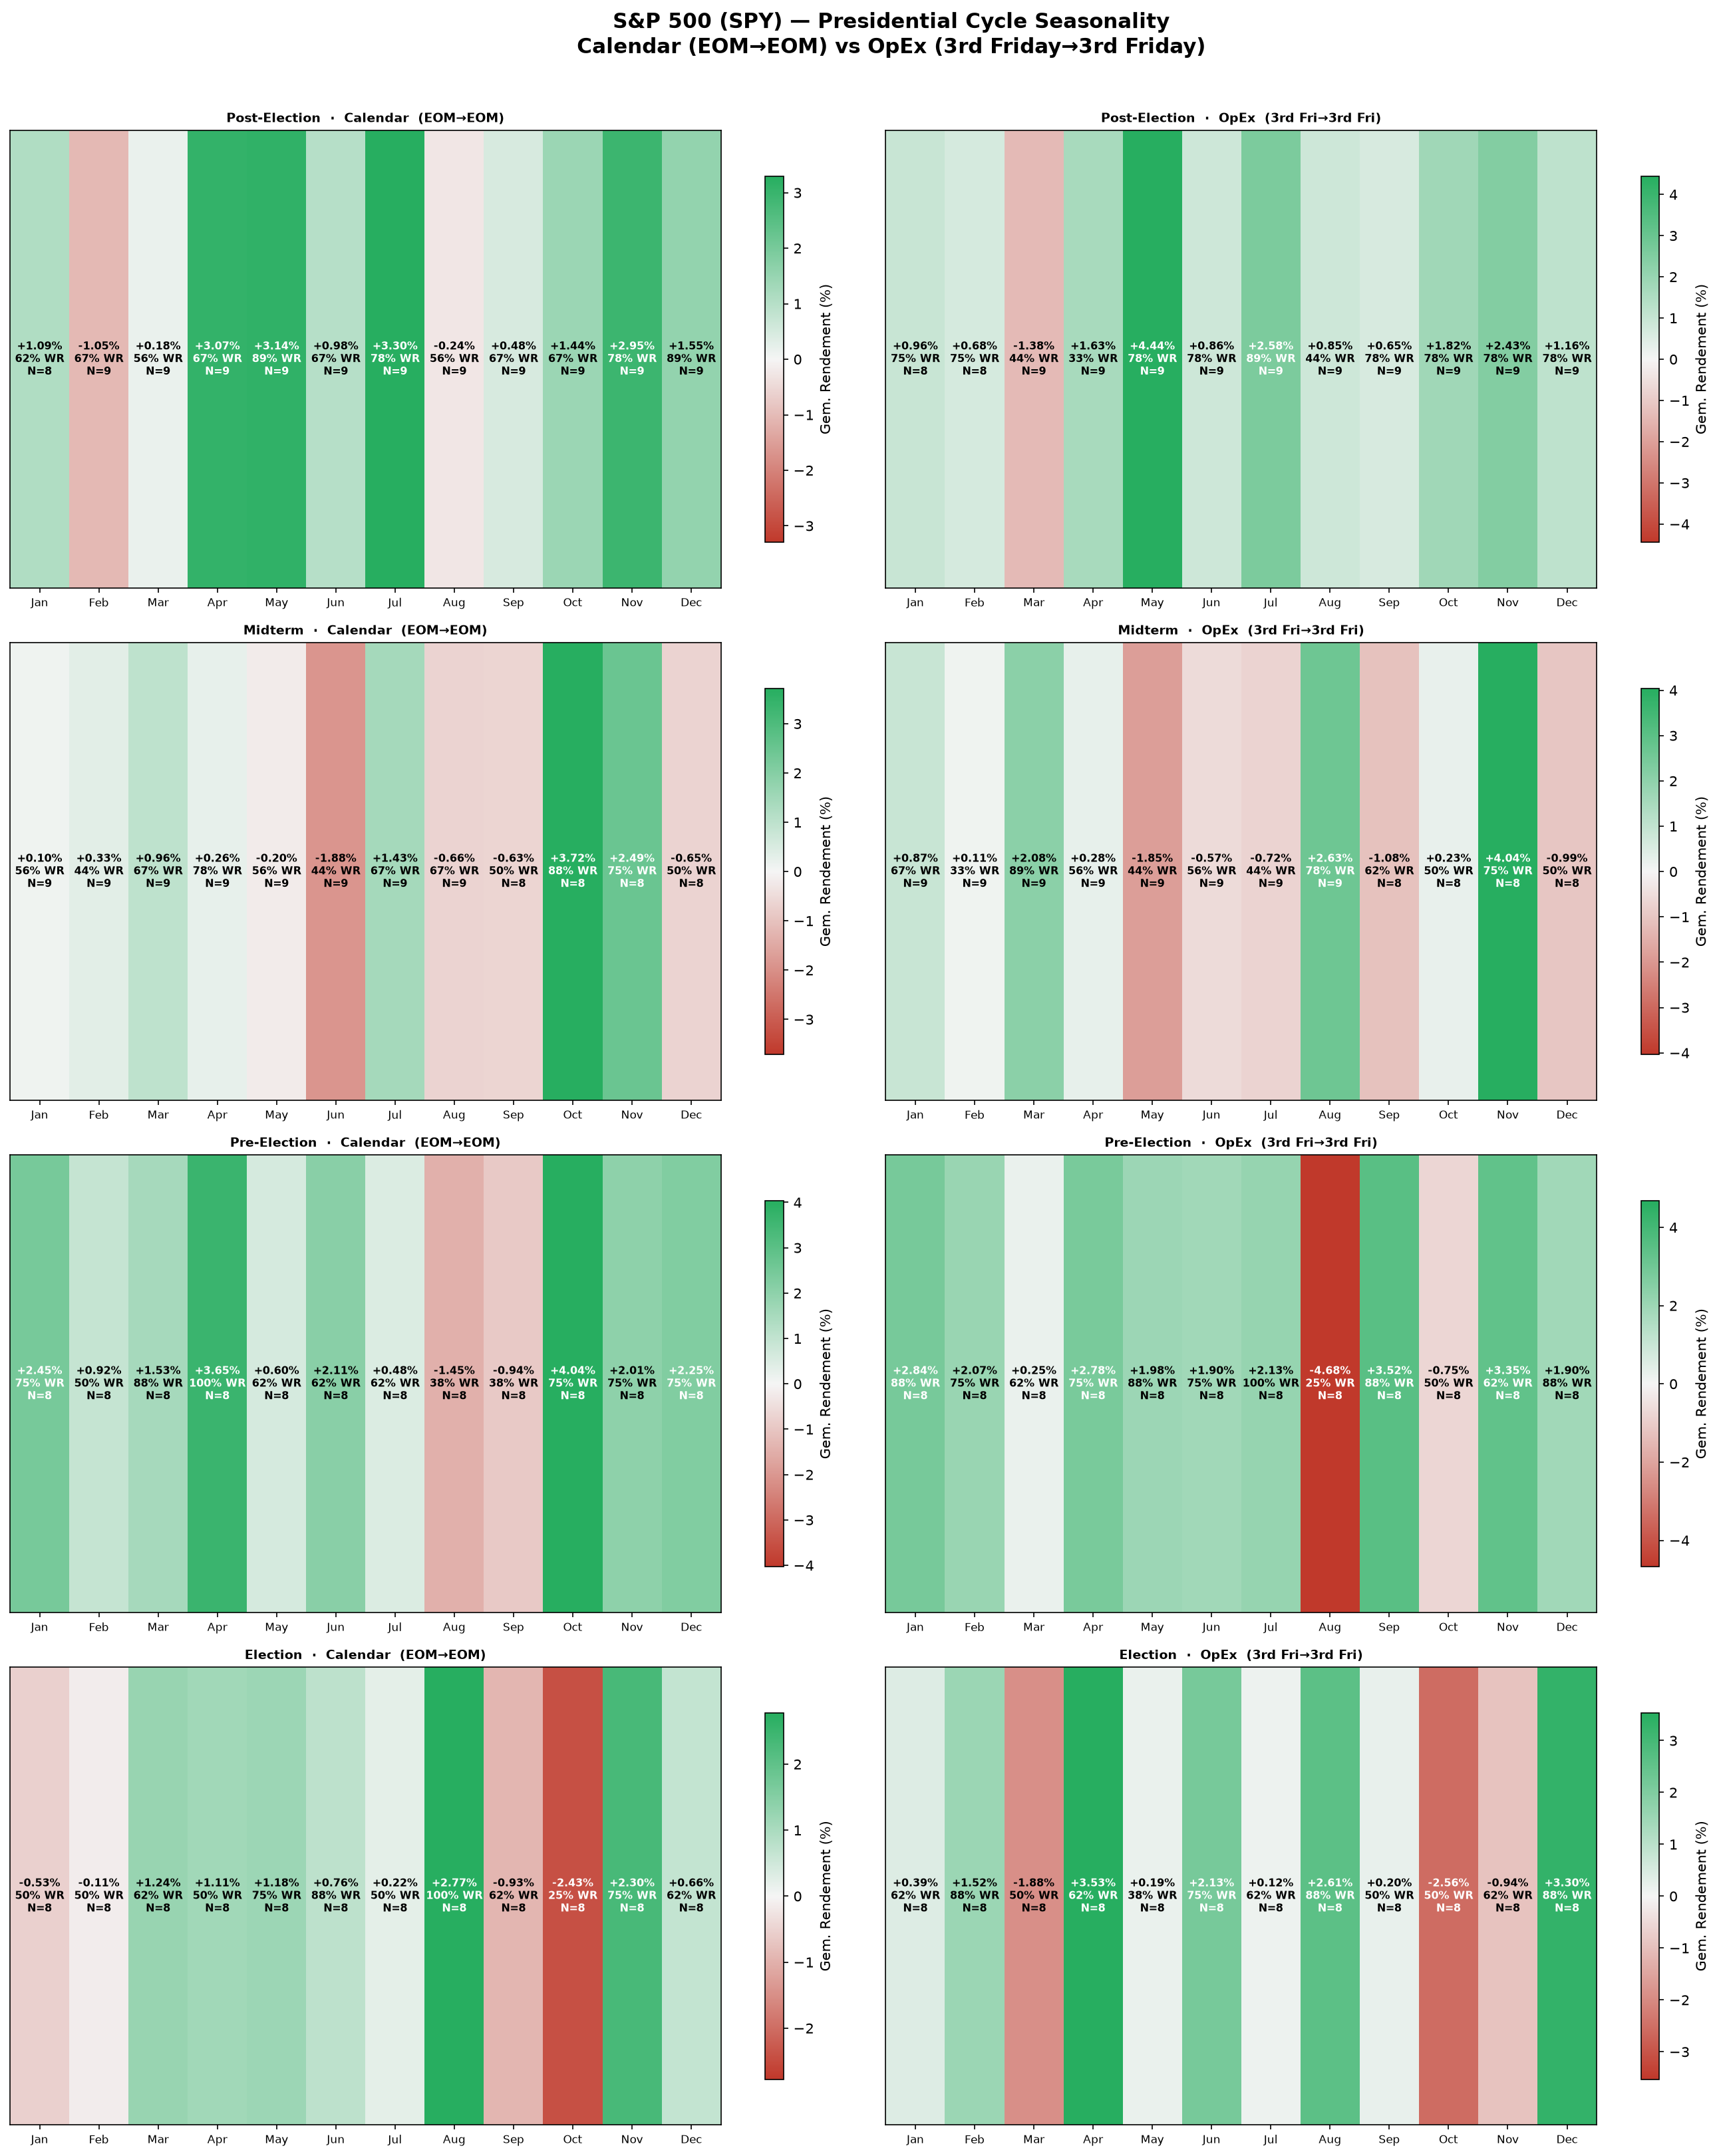
A pivotal discovery in our research is that measuring returns from Options Expiration to Options Expiration (3rd Friday to 3rd Friday) generates clearer and more decisive trading signals than conventional calendar months (1st to 1st) in 3 out of 4 cycle years:
| Cycle Phase | Strong Signals (Calendar Month) | Strong Signals (OpEx-to-OpEx) | Superior Framework |
|---|---|---|---|
| Post-Election (Year 1) | 6 Distinct Signals | 6 Distinct Signals | Tie (Equal Clarity) |
| Midterm (Year 2) | 3 Distinct Signals | 5 Distinct Signals | OpEx (+67% Signal Density) |
| Pre-Election (Year 3) | 8 Distinct Signals | 10 Distinct Signals | OpEx (+25% Signal Density) |
| Election Year (Year 4) | 3 Distinct Signals | 7 Distinct Signals | OpEx (+133% Signal Density) |
Why OpEx Cycle Measurements Outperform
Institutional rebalancing, systematic gamma rollings, and derivatives settlements naturally cluster around the 3rd Friday of each month. Anchoring seasonal analysis to OpEx dates mirrors real capital flows and dealer positioning far more accurately than arbitrary 1st-of-the-month cutoffs.
4. OpEx Seasonality Heatmap & Matrix
Below is the complete matrix mapping all 48 cycle months classified by OpEx-to-OpEx performance over the 1993 – 2026 empirical dataset:
5. Seasonality Curves & Year-by-Year Performance
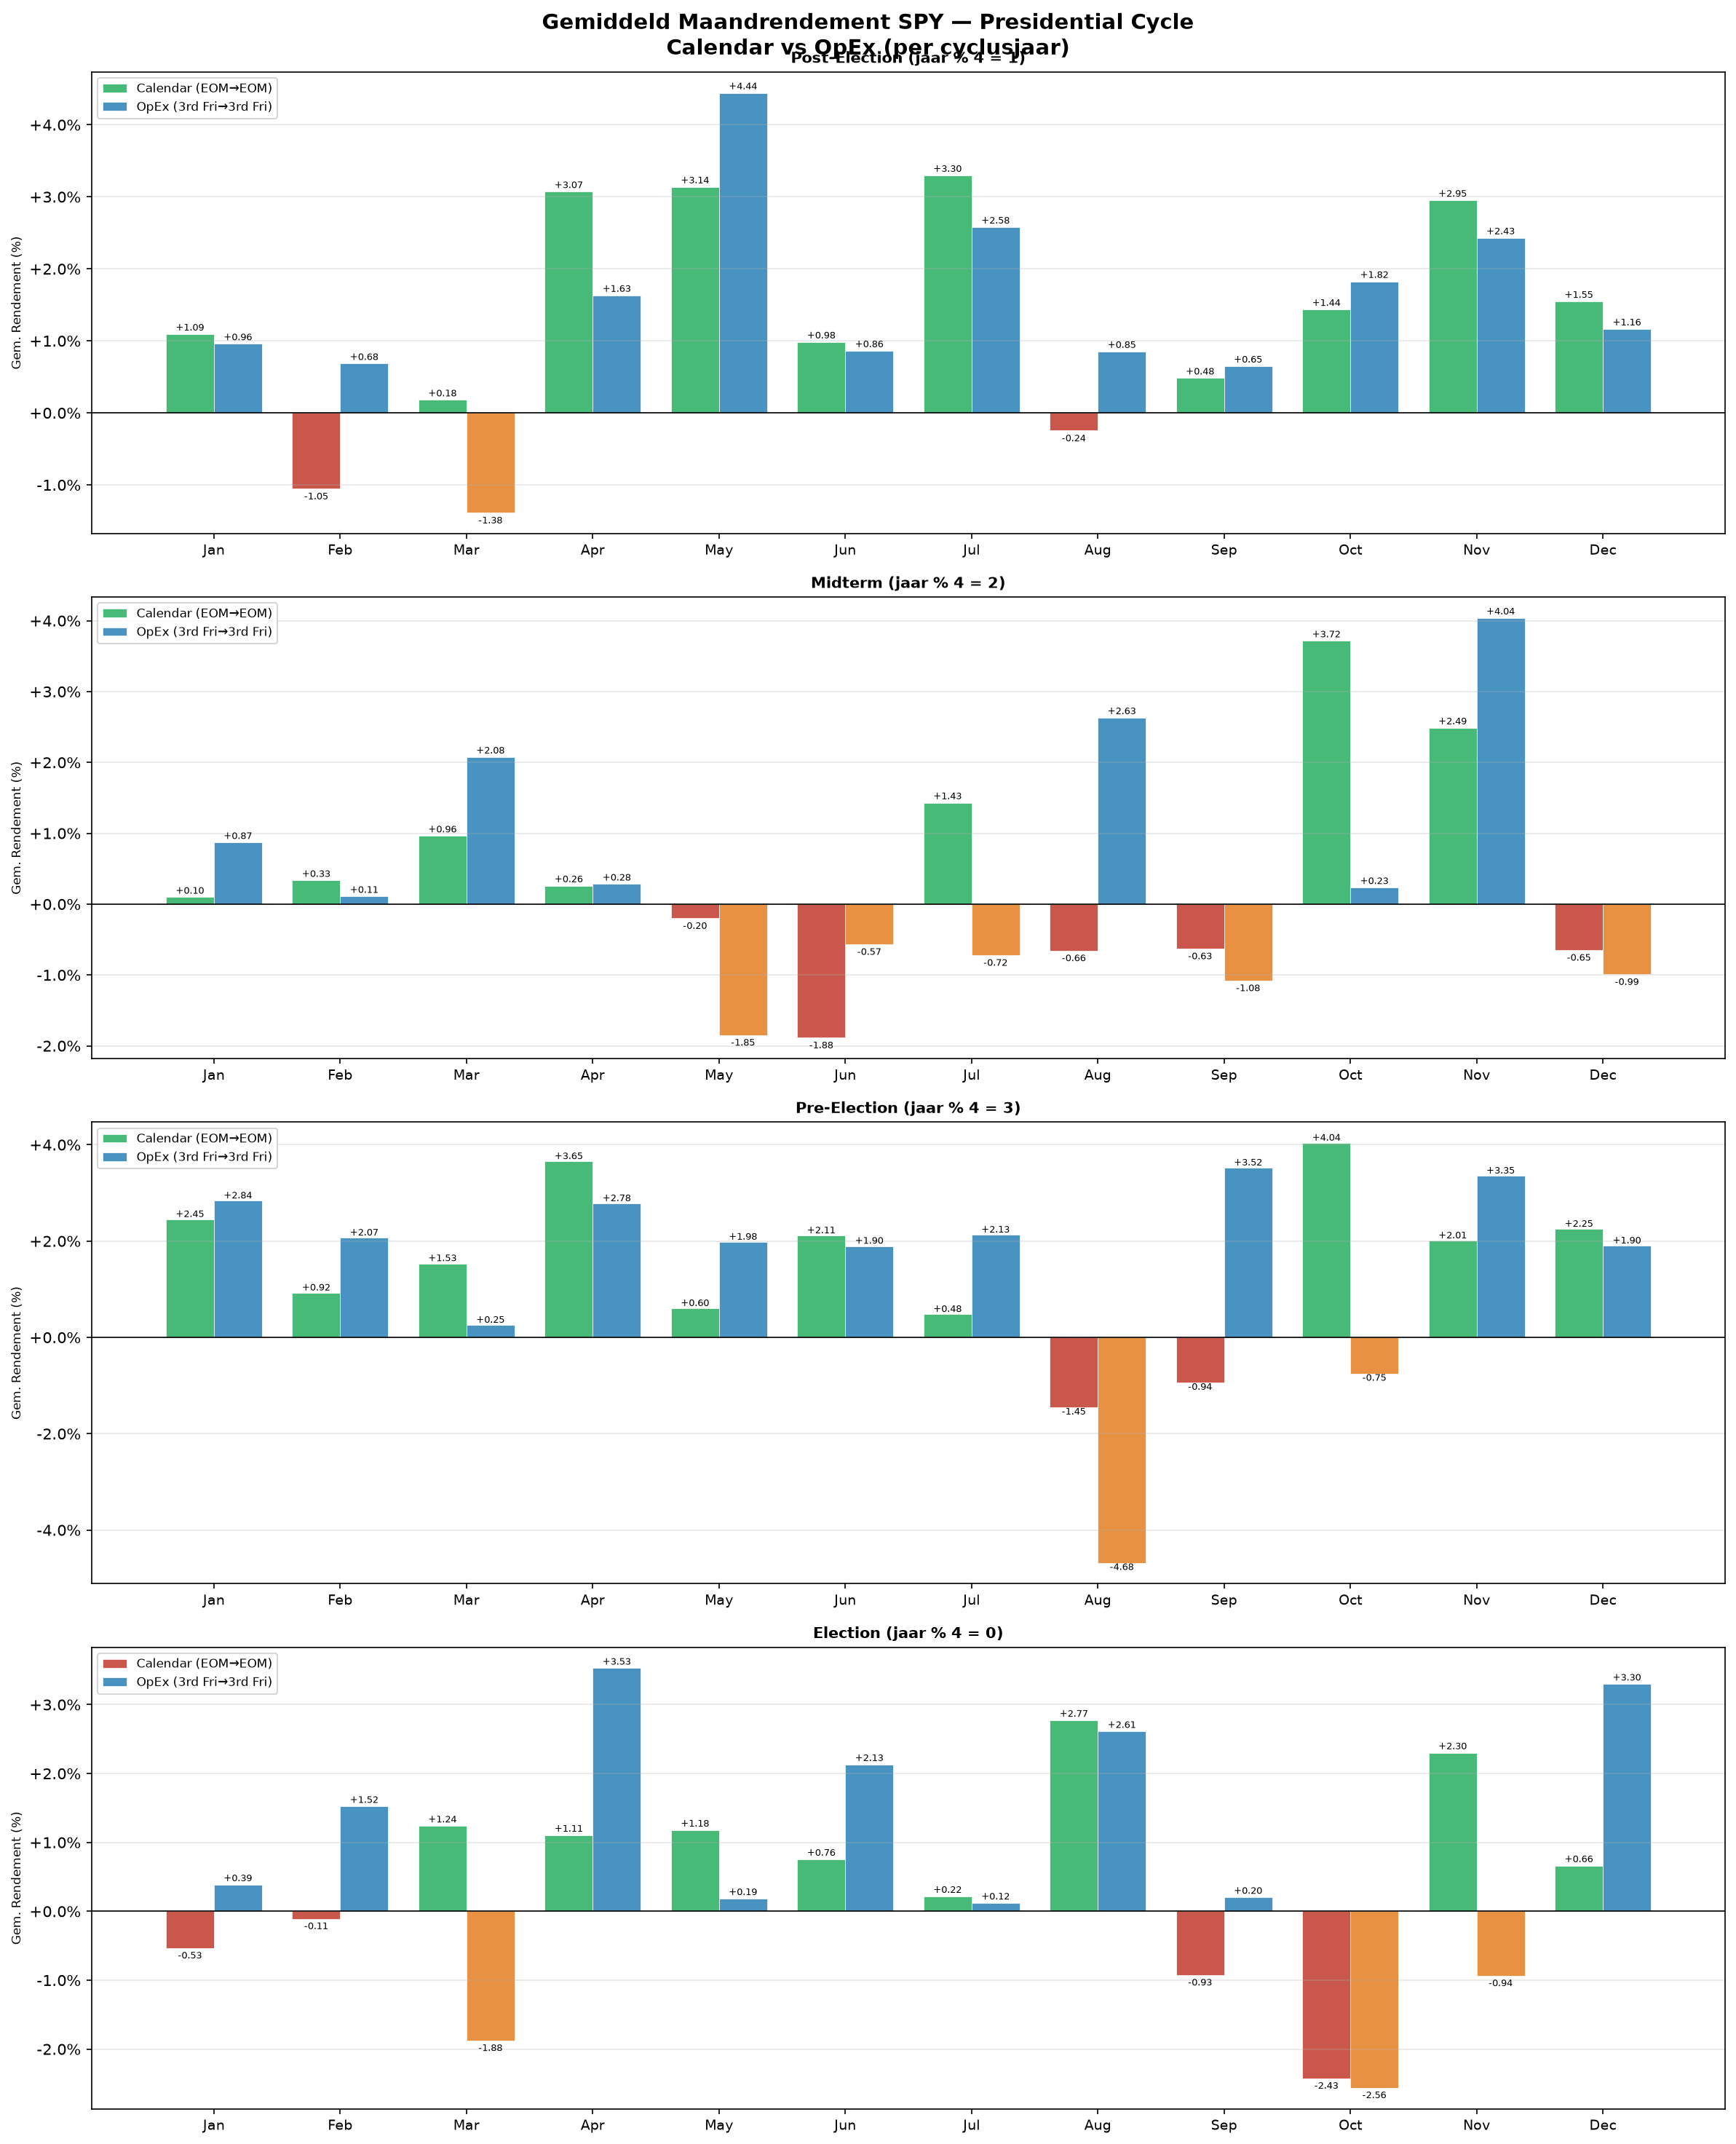
Comparing cumulative returns and average monthly distributions highlights the dramatic structural differences across cycle phases.
6. Key Actionable Rules for Traders & Investors
How can systematic option traders and portfolio managers translate these macro insights into profitable execution?
Contextualize the Cycle Year (1 to 4)
This single macro parameter sets your baseline risk posture. In Year 3 (Pre-Election), sell puts and buy dips aggressively; in Year 2 (Midterm), maintain higher cash reserves and prepare defensive hedging through summer.
Anchor Execution Around the 3rd Friday (OpEx)
Do not adjust portfolio positioning on arbitrary calendar month-ends. Align your core entry dates, option rolls, and rebalancing around the 3rd Friday monthly options expiration cycle.
Avoid the Major High-Risk Danger Zones
Respect historical drawdown windows: Midterm September (mid-Aug to mid-Sep), Pre-Election August (mid-Jul to mid-Aug: -4.68%), and Election October (mid-Sep to mid-Oct).
Capitalize on High-Conviction Seasonal Setups
Deploy maximum size during verified macro tailwinds: Pre-Election July (100% historical win rate), Midterm November (+4.04% post-election relief), and Election December (+3.30% continuation).
Research Disclaimer
This analysis is conducted by DataSente Quant Research for educational and informational purposes only. Options and derivatives trading involves substantial risk of loss and is not suitable for every investor. Past performance is no guarantee of future results.